Datawrapper
With Datawrapper, users can effortlessly create stunning charts, maps, and tables using 20 interactive chart types and three map styles. The platform allows for easy data... With Datawrapper, users can effortlessly create stunning charts, maps, and tables using 20 interactive chart types and three map styles. The platform allows for easy data import from various sources and offers extensive customization options. It empowers organizations, from newsrooms to non-profits, to effectively communicate data-driven stories.
Top Datawrapper Alternatives
AnyChart
An award-winning JavaScript (HTML5) charting library, AnyChart empowers developers to create stunning interactive charts, maps, and dashboards for web, mobile,...

RAW Graphs
Designed for data enthusiasts, RAWGraphs offers nearly 30 unique visual models to effectively represent quantities, hierarchies, and time series. This...

Omniscope
Omniscope offers a powerful suite for in-memory data editing, processing, and analysis through its native desktop application, Omniscope Classic. The...

ERBuilder
ERBuilder is an intuitive data visualization software that enables developers to design and model databases using entity relationship diagrams. It...
Plotly Dash
Plotly Dash is an advanced data visualization software that empowers users to create interactive applications seamlessly integrated with AI and...

CYS
A powerful software solution, CYS integrates feedback and data from customers, employees, and businesses, streamlining insights for over 15 years....

KnowledgeHound
Unlock rapid insights from customer survey data with this intuitive data visualization software. Designed for teams of all sizes, it...

ActiveReports
ActiveReports 13 is a powerful data visualization software designed for seamless integration with Visual Studio versions 2012 through 2019. It...

ChartBlocks
ChartBlocks enables users to transform their data into visually appealing graphics without any coding. With an intuitive interface, it allows...

GENESIS
GENESIS version 11 redefines automation software, integrating advanced visualization and a data-centric design for efficient deployment. With robust security protocols...
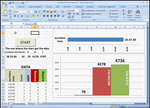
Excel Chart Animation
Excel Chart Animation is a powerful plugin for Microsoft Excel that enables users to create dynamic and customizable animated charts....

Zebra BI
Zebra BI empowers users to transform complex data into stunning reports and dashboards with ease. Its IBCS-compliant visuals facilitate clear,...

Zebra BI
Zebra BI enhances data visualization by adhering to IBCS-compliance, ensuring consistent interpretation and understanding in business reporting. With customizable themes,...

FLiQ
FLiQ is an advanced data visualization software designed to enhance efficiency and predictability in industrial operations. By integrating data, technology,...

Brain EKP
Brain EKP empowers users to visualize and enhance their thinking processes, seamlessly integrating thoughts and ideas. By transforming complex information...
Datawrapper Review and Overview
The content which you want to present to the readers will capture their attention only when apart from the text, it contains beautiful maps, or charts, or tables. Datawrapper tool helps in creating and modifying such content for you.
Charts by Datawrapper
Datawrapper helps in creating beautiful charts. It provides various kinds of charts. The Line chart prepared by Datawrapper presents developments that take place over time. You can also add annotations or change the color of the Line chart. Then they have the Stacked bar charts, which are very interactive in nature. To display the shares of a whole, it has the option of the donut and pie charts. To display the correlation between variables, it provides you with the Scatterplots. Similarly, to show the difference between the variables, it makes use of the Range plots.
Maps by Datawrapper
Datawrapper is capable of creating interactive maps. It gives you the option of creating the Choropleth map to color those regions which have values in your datasets. You can easily use them to display regional patterns. You can modify the colors of this map using the Datawrapper tool. Then there is an option of Symbol maps that are capable of displaying symbol sized information for a particular location.
It contains many base maps related to administrative regions so you can choose from them according to your requirements. It does provide you with Locator maps that are good enough to show the location of any happening or events in the city. It also gives you the option of creating and styling markers for your map. For the markers, you may sometime need to provide more information; then, you can make use of the tooltips of Datawrapper for doing so.
Tables by Datawrapper
Datawrapper generates tables that are responsive in nature. You can modify and style the tables according to your suitability. You can either highlight the important rows and columns or can even tone down the less important rows and columns. You can also perform the formatting by changing the color of the fonts, background color, border, etc. It does offer the sorting and searching options in the tables.
Why use Datawrapper?
It helps in creating digital maps, charts, and tables. You don’t have to worry about any technical coding to use this tool. Datawrapper works on the web, so you don’t need to install or update anything. It does make use of the designing rules to provide you the best result. It also provides you with custom styling and editing option.
Company Information
- Company: Datawrapper
- Country: Germany
Top Datawrapper Features
- 20 interactive chart types
- Three responsive map types
- Heatmaps for data insights
- Customization and annotation options
- Live-updating charts from URLs
- Easy data import from Excel
- Google Sheets support
- Responsive data table options
- Interactive embedding for websites
- Export charts as PNG/SVG/PDF
- Case studies for inspiration
- Extensive data visualization articles
- Built-in search functionality
- Pagination for data tables
- API for custom integrations
- User-centric design focus
- Support for non-profits and enterprises
- Interactive storytelling capabilities
- Regular updates and improvements
- Dedicated customer support access.
