
Clicky Review
Detailed Reviews
In this Internet era, people explore millions of websites every second, doing various activities across them. With so many sites, it is difficult to monitor our own site, along with getting details of other sites to compare our progress.
Since the content on web is in excess, it is tricky to get good traffic on a site, without doing something extraordinary. For improving our content, we need every relevant site statistics. And using all site statistics, we can know about page views, clicks, downloads, and all such interactions on our site. This is where Web Analytics plays its role.
Pros
- One of the most austere setups in web analytics.
- Real-time web analytics. The spy feature updates website data instantaneously.
- The tracking code is secure and prevents backtracking.
- Can customize dashboard for every site you add for analysis.
- Visitors stats are very meticulous with heatmaps. It can identify traffic source as well any type of engagement with the site.
- Detailed content reports with a list of all entry links, total downloads, etc.
- Search stats returning lists of keywords, top search engines used, etc. for your site.
- Lists all inbound as well as outbound links. Also, it records connected domains.
- Thorough location tracer yielding full data on visitors location, and other related stats.
- It can set goals and campaigns instead of using a separate marketing software.
- Monitors uptime status of your website.
- Allows saving reports in multiple file formats.
- Link Twitter account and see top 100 search stats for your site on Twitter.
- Decent pricing and comparatively cheaper plans than other paid analytics tools.
Cons
- Lacks an aesthetic UI. Too elementary for modern taste.
- Needs to have better and more graphical data, than plain numerical stats.
- Supports only twitter searches
- No exhaustive video tutorials
- Device info still needs more precise execution.
- Needs to integrate more features directly into the plugins.
- Too much, and averagely organized data on hand. May overload some users.
Introduction
All these data can be found by use of tracking code, or separate tracking plugins. Without such site statistics, we cannot learn about viewer demands.
To aid us in getting thorough site statistics, we have a program called Clicky. It was created in the year 2006. With this program, users can obtain numerous statistics on their website. It was launched by company Roxr, in Oregon, USA.
In the initial phase, it did not have much customer base. With time, and mostly by word of mouth, they have presently encompassed 700k websites under their garb for tracking.
They have partnered with Webs.com, a free website maker tool, and facilitated them in advanced web analytics. Clicky is still one of the swiftest, simplest, and trustworthy tool for web analytics.
In our review, Clicky is going to be analyzed thoroughly. We will also use the Demo Mode to work out some features, which otherwise take time to render statistics.
Visiting Clicky and Learning its Use
Before we start experimenting with this web analytics tool, we have to be somewhat familiar with its use, and also need to learn how such data works in web analytics.
We will put some ephemeral info and comparative analysis here. Using this, it’ll be easier to explain all such data with practical values. With that, your opening taste for Clicky can be acquired by visiting Demo Mode on their website. In here, Clicky has used stats from their blog.

There are several sections of analytics in this setup. It opens with home tab, and then spy, visitors, content, searches, links, platforms, locale, goals, campaigns, uptime, social and prefs.
Huff! So many things to understand and review! Tiring, isn’t it? Well, we can climb even mountains to review above. Now, if you wish just to goof around, go through these tabs.
The front tab shows basic info of the website you are tracking. The summary includes number of visitors, their actions, average actions, net time, time per visitor, bounce rate, and goals.
There is a graph on side of this summary chart with daily visitor info. Below this section, they have arranged content section, to display the most visited items during that time.
In a nice UI trick, you can hover to number of visits, and see the % share of that page in total site visits. Then for the % traffic increase, you can click and expand it to see pertinent data for that time.

After this, you can view the uptime of a site, Twitter searches, and other searches across internet. In demo mode, the results were mostly regarding PayPal issues, which the tool had picked from web.
You can also sort these searches based on individual keywords, recent searches, unique searches, etc. These searches are leached from Google’s search results, except the encrypted ones.
Below this, there’s a list of recent visitors. The ID shown here is of ISPs. Besides this, you get results for traffic sources. Isn’t it amazing to get so much data on a single page?
You will slowly get a grasp of various analytics functions. Web analytics is neither so simple nor too hard. If you read about these terms, simply getting to know the basic definition is sufficient.
Overall, the base statistics are enough to give an idea about traffic source, their search habits, visits, and all such data summarized. Compared to other tools like Stats Counter it is simpler to decipher data in Clicky.
Reviewing Various Web-Analytics Aspects in Clicky
Now, after visiting the main panel, we can visit individual tabs to see what kind of analytics they reveal. It also depends on the form of presentation for these statistics.
Most of us expect Clicky to give us sophisticated yet straightforward analytics data. This is completed by using more graphs, bar charts, and many such visual data.
Once you are out exploring the main dashboard from home panel, we can examine all of them here in more detail in subsequent sections.
Spy Feature
With so much data to assess daily, we need some sort of automation to monitor our sites. Like the traffic authorities get live data of things on the road, we also need live data of traffic on our site.
For that, we can install our own scripts on the site which will return us traffic. As everyone cannot write a code for that, we can use Spy Feature of Clicky.

The main task of the spy feature in Clicky is to return the data of live traffic feeds. This includes visitors currently on your site, those that clicked any links, searched something on your site, etc., in real-time data.
As we said, a code/script is needed in your site to track this data. This is provided by Clicky. The script can be toggled for JavaScript versions too.
After that, it will track all access/visits. Clicky has some inbuilt features to differentiate bots from normal humans while collecting results. Contrarily, you can disable it, and exclude these bots from visitors.
Over to the main panel here, Clicky has shown a small world map in the top region. Whenever a person engages with your website, it is exhibited on this map.
They’ve made some significant UI changes here. Whenever a new person pops on your site, it will ping the location on a map with visiting URL flagged on it.
On the sidebar, options viz. content, countries, cities, and referrers is shown. From each of these, you can fetch live information. The content tab shows the page URL being accessed, countries & cities will point their geo-locations, and referrers show links from where they’re redirected.
Switch New Visitor Alert ON, so that you get a notification for every new guest. On the bottom section, you can see tons of URL, along with different IP addresses, and various pages from your website.
It has shown even the date/time, browser used, OS used, and exact URL used by a person. Clicking on any of these visitors will open a new tab in the visitors' section, which we’ll review later.
Overall, this data is more than required to view information about live visitors on your website. Only con is that you need to install scripts into the header section of your site. There is also a limit on number of visitors shown on this panel, which is top 40 recent visitors.
With this, they can add more features like other product who.amung.us, which uses a code to show these results directly on your own website. They can also add more info on this panel, like visitors status, new visitors, returning ones, bounced visitors, etc.
Still, Clicky has made fantastic efforts here. The live update is fast, and so users need to wait long. After this, we have to move on to see more statics about these visitors.
Checking the Visitor Stats
Now, once we know that our website is starting to get prominent, we also need to learn more details about our visitors. So, why do that? How is getting more info of our visitors going to help us?
You know, what if the visitors are merely bots accessing our site? Alternatively, maybe someone is trying to hack your site? We can find all this data with a visitor tracker tool.

Data of the visitors, like their IP location, their behavior, i.e., human/bot, traffic source, inbound source, actions on your site, time spent, etc. can help to decode every scenario of visitor’s intents.
So, in the tab besides spy feature, you can access Visitors Tab. This section also has multiple divisions viz., visitor logs, action logs, custom data, most traffic, traffic sources, and engagement actions/time.
They have comprised almost everything in it. Some more can be added, like average time spent, returning visitors, bounce status, bot status, etc. They can add some visual graphs too, with average stats.
Nevertheless, the number one option Visitor Logs was used to display the visitor data on it. The primary data here is about access time, IP location, page accessed, actions, and time spent.
You can select a date, month, week from the top and see entire data of that period. There’s an option to export these results too, which can export them in PDF, CSV, XML, JSON, and PHP format.
Apart from that, a user can pick various filters from Filters Button. In this part, you can separate visitors based on online status, type/number of actions, visitors status, landing page access, traffic source, top searches, browser type, location, hardware used, etc.
You can input multiple criteria for the filters, and save each of them in Saved Section. This again points Clicky’s nerdiness, which is excellent, to be honest.

Next to visitor’s log is Action Logs, showing activities conducted on the website. Without activity info, merely counting number of visitors is no good, which may hinder devising proper services in future.
Action Type records downloads, page views, outbound links, events, media, and search types. Then, Page URL has lists all URL related activities.
It is sufficient to utilize this feature to filter out users. They can add more items in this filter like viewed media, number of clicks, internal page visits, etc.
Clicky, once again needs to put in this data via graphs. That’ll render scanning all filters simple. If they want, they can limit number of filters for graphs, but adding this UI feature will make it better.
Even in case of login forms, or email campaigns, users can utilize Clicky to collect that data. With this, Clicky can add details to your campaign reports. It can even track registered users and can see their actions.
However, this can be made more accessible by using a Clicky plugin. Our website was WordPress based, and so we only had to search for Clicky plugin, install it, and then configure it. After which, it naturally tracked users on our site.
The Most Active tab allows viewing page view stats. It can be sorted based on either number of visits, or page views. Clicky also shows the percentage stats out of it. They are also shown in form of horizontal bar graphs.
With this, we can directly compare which user, from which location, has highest visits, or say was most active. Then comes the Traffic Source log.
Traffic sources indicate web location from where a user has visited your website. It can either be from other websites, search results, direct URL, etc. Clicky identifies these sources, and generates data here. It can also yield data on inbound links of your site.
Regardless, we need not to go that deep here. Keep in mind that these traffic sources are not 100% reliable, mostly when we use redirecting URLs. But, they can surely help us know visitor base locale.

When you click on a traffic source, you can view more details about it on next page. This is similar to visitor info we reviewed earlier. Only exception is that now we can filter out every traffic source separately. They must also add an option to see a visual graph for various traffic sources.
The last selection is Engagement Tab. As its name shows, admins can view site info on how their visitors used their pages. Every action, be it visits, downloading, login, etc. are counted separately.
However, the type of action is not displayed here. The engagement action shows results for number of actions per visitor. In short, it can group visitors with single actions like page view, net visits, or other actions on the site.
These results are shown in form of numbers as well as net percentage. For engagement time, you can see total minutes every visitor spent on a page. But, we found that they can add one more things here.
This was a graph showing time spent, and visitor count, for a set date range. All in all, most users will be satisfied with this. They have tried to assimilate so much data in visitor stats. One emphasis we can lay on is to put in more graphical setup.
Content Report of your Website
With so much visitor info in previous sections, it is time to see what our viewers actually saw the most. For that, content reports are the best.
This section generates reports on various contents viz., pages, entrance/exit page, downloads, events, media, and domains. With that, we can check what each of these holds for us.

Pages Report shows pages with highest views. Yes, views! The reports in this section are only based on views, and not any other actions.
The pages with highest views are shown on top, with exact count and percentage. You can also see total visitors, average page time, net time by all visitors, and exit page info.
Users have three choices to pick beside each report, i.e., heat map of the page, top next/previous page, and external links. There are some numbers in percentage, with green and red color on each side. These signify increase or decrease in page view count.
Once again, each page has some individual stats, and clicking page info will open these stats. Entrance pages or landing pages are the ones where visitors initiated their session.

This report shows top entry pages and how many visitors it gulped. Rest all figures are for average actions, time, net time, bounces, and % increase/decrease in-view rates. Similar to this is Exit Pages. Only difference is that these were the last pages after which we left that domain.
Then there are similar data on the number of downloads. The Events Tab allows to view any JavaScript menus, click rates or any of these unconventional reports, which are usually not trackable by reasonable means.
Then they have inputted media analytics too in this section. Users can view the audio/video engagement by users on a given site. However, as per their statements, this particular task is arduous, given that it needs too much complex coding, which normal users cannot do.
Lastly, if the website being tracked has multiple domains up its sleeve, Clicky can help in finding it out for you. Based on that, it will show the traffic results per domain.

Overall, this was all in the content report in Clicky. As we have seen, all the above reports are beneficial for website analytics, and Clicky has given exhaustive data on each of them. This, combined with such low priced service, outs Clicky as one of the top products in web analytics.
Search Stats of your website
After current site data in our hands, we now have to find out how search results affect our site. We also need data on what kind of search keyword returns our website link on various search engines.
For that, we need to extract this data from search engines themselves, which is very difficult. Most search engines now employ Secure Search, which is for the users that are logged into their accounts.
Due to this, search engines like Google mask them. Not even Google Analytics can access this private info. That’s the reason Clicky has used the term Secure Search for results from such sources.

Now, the Search Function in Clicky has to offer several item details viz., individual searches, keywords, engines, recent, newest unique search, local search, and rankings.
All of them have data shown in most basic form, and so it is tough to differentiate between Clicky and other products which lack much graphical assessment in here.
Unfortunately, due to secure search, searches by users for so many items related to your site cannot be found. Still, there are certain backdoor ways, which are out of scope of this article.
Other than that, Clicky considers any info it gets after data mining these terms. More than 50% of the search term results belong to secure search category, without any exact keywords.
Now, out of multiple information tabs, the initial Search tab displays a list of exact search terms. These terms would have redirected to links on your site, and so they are relevant.
Let's say you have a blog post on how to spin sweater for kittens. Depending on search terms, the search engine will show your blog post link for a particular keyword. If someone searched sweater for kittens, which redirected to your links, Clicky would include that in this tab. Off course, this is for non-secure searches.

After this, they have Keywords Section. As we all know, keyword plays a vital role in search engines and how traffic is diverted to your site. Without a proper keyword, either from user side or proper page title relating to searched keywords; we cannot direct traffic on our page.
Clicky uses this data of different keywords which have directed users to your site. E.g., in the demo mode of Clicky, go to the search section and then to keywords tab.
In here, you can see that the highest-ranked keyword for Clicky Blog is PayPal. Since Clicky has a post on “recent issues with PayPal,” people searching with keywords like PayPal, problem, issues, 2019, eBay, down, etc., are directed by the search engines to Clicky’s post, via search results.
You can see % traffic pulled by these keywords, and maybe change the page title to push your page rank further w.r.t searched keywords. Now, they need to add a statistics graph too. We can only know the highest-ranking keyword, but not the fluctuations in it with different dates.
Obviously, as long as the search trend exists, we can see our results on top. But the technicality in article, solutions, etc. keeps us in the rankings. This way, we can update our posts based on rise or fall in traffic w.r.t such keywords.
Nevertheless, in web analytics, any amount/type of data will always feel less. Moving on, you can see a Search Engine tab. In here, search engines that directed traffic to your site are shown.

These can be either of the popular pages, like Google, Yahoo, Bing, Yandex, Baidu, etc. This section will also display the top-level domains as well as other subdomains in the search engines. Country codes are visible in these domains, and so you can figure out the highest traffic country.
Similarly, Recent Searches show searches directed to your site, in nearest time. Newest Unique shows results based on unique keywords that brought new users to your site. These results also include redirection links for your site.
Finally, Local Searches displays results for internal searches made by your visitors. In our website, we used different devices to search for keywords, but Clicky was not able to show them instantly. His Stats, Hit Steps, etc., live updated these in their main panel itself.
Now, the search query was put in the right place, and even the plugin was working fine. The search wasn’t encrypted, and yet no results were delayed.
After some tries, it finally started showing search results. It may be some bug possibly, but we are sure that from our end, things were configured perfectly. Nevertheless, better late than sorry, it finally worked.
Besides all these, Clicky has also given an integration with SheerSEO, to involve a third-party tool for monitoring data of your website.
With this, we put an end to this segment. For us, this was a marvelous experience. Clicky has done everything in their limits for adding stats here. Although, the UI can have some improvement and include better graphical approach.
Getting Details of Links and Referrers
Checking the number of visitors, their actions, time spent on your site, etc. can be unusual. However, we can make it more interesting by trying to get details of links interacting with our website.

This means we can check which are inbound links or say referrers, outbound links, new links, etc., using Clicky. Just go to the Links section from the top menu.
In the links section, they have included popular link statistics like incoming links, outbound links, domains, recent, and newest unique. All of them represent different link types based on various web stats.
Starting with incoming links, they are also called as Referrers. This is because they refer, or say redirect to your site from their links. On the Clicky panel, these links are quite visible.
All of these links have embedded your site URL in one form or another. Whenever such redirect happens, that info is carried out by the URL, which is then captured by Clicky. In the end, they put it here. With all this data, we can understand which sites trade our links.

You can add a star to a link you want to focus on. After this, clicking on individual links shows detailed traffic data via that incoming link.
Similar to links, Domain Referrers too show similar results. This shows even the domains, sub-domains which act as referrers. Also, it is used to collect all data from a single site domain. With this, you can also see if any irrelevant domains are hijacking your traffic.
Now, Clicky often uses the term Newest Unique for some items. This simply means that visitors are new users. So, this unique tab shows links from where new users have arrived on your website.
Then, Recent Tab details about most recent access to your site via any external links. These are once again inbound links, except that they are fresh, as Clicky articulates.
Lastly, outbound links are the ones that your site redirects to. This can help maintain our collaboration with sister sites. We can also see the percentage rise in that outbound link after we linked them to our site.

One more thing of interest here is clicky.me URL. What is this URL and how it's unique? Well, this is a URL shortener by Clicky.
With this, Clicky allows us to track URL as well as visitors. Such feature is not given in every single URL shortener, and so Clicky gets a slight upper hand here.
With this, the link section helped boost info on various link interaction in our site. To be honest, we didn’t feel the need to augment anything here. Overall, the results were trustworthy and were updated quickly.
Inspect Device Info of Visitors
Even with so many stats, it is necessary to see device info of every visitor. But, what do we need device info? What can be accomplished by knowing it?
For such questions, we can say that knowing a user’s device can help us in optimizing our website. Suppose, most of your traffic comes from mobile devices, then it is better to reduce scripts in it, and optimize content as per mobile view.

This can only be done if we know which device, hardware, OS, etc. are mostly used to access our website. For that, we can use Clicky’s Platform Analytics.
In this section, Clicky has offered info on Web Browsers, Operating Systems, Screen Resolutions, And Hardware. All of them are crucial in helping us decide how much optimization is needed for which version of the website.
This also helps in making a schedule to update site features. We can start with the ones having lowest traffic to test new features, and if any bugs persist, the majority is not affected by it.
In the opening sequence, Clicky has provided info on web browsers used. They have include tons of web browsers for that. To directly sort out a specific type, we can use the family filter on top.

The starred browsers are on top, whereas below it, they are arranged by number of visitors. After that, results for operating system, screen resolution, and hardware used are shown.
Hardware tab can show exact devices used too. Although, Clicky only showed names of few hardware, and most results were under other filter. They can further improve this detection to return accurate results for hardware used.
Regional Info of Site Visitors
Visitor location! Another important term in web analytics, allows site admins to know their audience’s location. With that, things like local content, local ad targeting, etc., can be optimized.

This is one of the vital info given by many analytics tools. Every common sites reveal the geographical data of the site’s audiences. Certainly we’d expect Clicky to be much advanced.
But here, Clicky has once again kept things on a good note. It will show country location, number of visitors, average actions, visit time, etc. on this dashboard.
Only con we felt here was that this section lacked an essential thing, i.e., graphical map. Rather than just putting some data on the site in spreadsheet-style, this could have been put very uniquely.
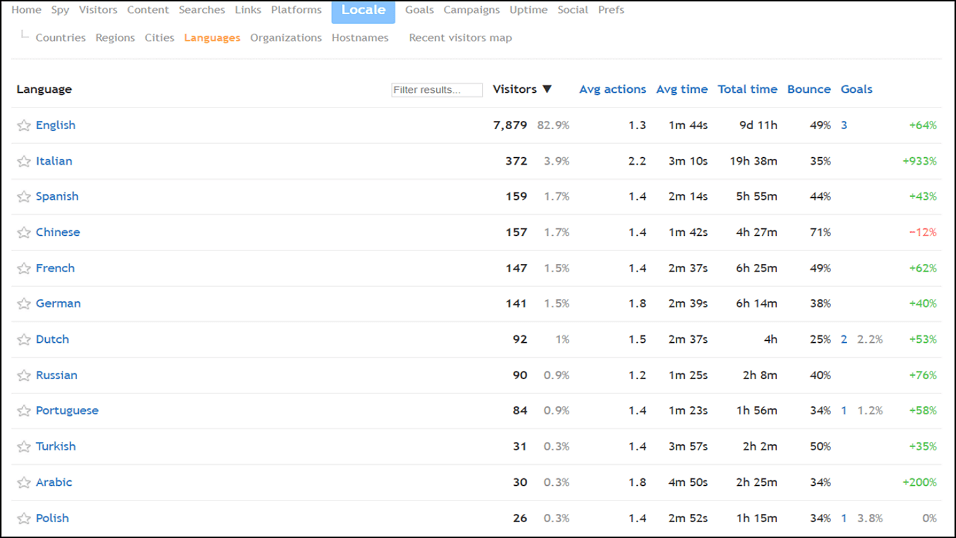
The Region And Cities Tab further filters countries to local counties. Then, the language section exhibits highest used language for your site. This is particularly useful since you can then provide better translation for native readers.
The Organization Tab permits admins to know about the ISP used by readers. Based on that, we can resolve to complain where the site is slow, blocked, etc., by particular ISP. In case of regions without net neutrality, it can also let us know which ISPs are dragging down our traffic on behalf of few competitors.
Then again, Host Name allows us to view the main computer networks used to access our sites. In the last part, Recent Visitors Map, they show the map info of last 100/500/1000 visitors.
Once again, there’s a filter like the one given in spy section. Admins must use it to narrow down visitor info. They can use these filters to separate the traffic for various countries.

Other than that, no exclusive info is there. Although they have shown a map, it could have been made to integrate multiple options of this session in it. That can save time, give better viewability, and will be less confusing. They can also give custom color picking for every region and allow to compare results for them in the map.
Settings Goals and Campaigns
To make things more interesting, we have to do some interaction with our visitors. This need not be in chat forms or something similar. This is a unique interaction where we set pseudo goals for our visitors.
With such goals, we can get more data from our visitors, and also see if they are interested in engaging with our site. These goals can be anything like net purchases, orders, cart filling, wish listing, playing lotteries, opening clickbait links, etc.
Based on data from here, we can provide them content accordingly. For now, Clicky allows options set up goals for visitors in basically four modes, viz., URL, Campaign, Search, and Referring Domains.

Using all these, we can set up criteria for our visitors to fulfill. This can be used for anything, from basic comment counts to lower bounce rates, and anything we can think using above combination.
The final results display completion rate, conversion rates, revenue, goal visits, and net time. Click on an individual goal to get more info. Similarly, users can set a split test here by adding data from your sites. Clicky will not participate in this test, except for showing results.
We can similarly set campaigns. These campaigns are similar to the ones we do in Email marketing. Only exception is that, there are fewer choices here. Clicky only offers to do campaigns for Landing pages, or Referrer domains.
The landing page is a direct approach, whereas the referrer domain is for dynamic approach. In the former one, users need to add specific page for inspection; while in later one, they just need to add some parameters of the desired page. With that, you can accomplish your campaign and goals.

But for both of these, they can’t be compared with standard products that conduct advanced inspection via goal settings, and benchmarking campaigns. Clicky lacks much sophistication in here.
Even for basic statistics, we would still advise using third-party tools, even if they have limited trial. That will give you much better learning in this section.
Uptime and Social Media Check
Now, these are the last two setups in Clicky. Both of these are quite common. With Uptime Checker, we have something different to ponder on.
Whenever there are any incidences of your website going down, Clicky will log that. From time to time, it will keep monitoring it. The setup for that can be done directly from the Uptime Tab in top navigation menu.

In this manual setup, users need to input a name, the time interval for the test, type of protocol used, i.e., HTTP, HTTPS, ICMP, etc. In the endpoints, you need to put site URL or domain. Add some content in match checker, webhook URL, and then email ID to send reports.
The report on Clicky site regarding uptime is necessary. It uses Monitage Services to administer uptime status. The report shows different test locations and corresponding response time. And below it, website downtime, with date/time, and time-span for it. Nothing exciting to be honest!
After that, the Social Tab is used to look at social media searches. Currently, only twitter is supported, but we expect they’ll expand it to Facebook and Instagram too. All you need to do is add a search term you are looking for.

With this, Clicky will fetch the data from last 100 searches and display things like total tweets, retweets, replies, tone, links, questions, @senders, @mentions, #hashtags, and list of all tweets fetching that keyword.
Honestly, this feels like a social media analyzer tool. Although the features are limited, these are enough to get details of a running account. Make sure the keyword used is appropriate and not reporting useless info. For that, try to use the Twitter search first, and then filter out results with additional unified keywords.
Lastly, in the General Preferences Menu, there are lots of customization for users. They can update general info of their sites, custom code for the trackers, and so on. Also, Clicky allows them to create separate dashboard for their site, only with preset parameters.
Final Verdict
Having used Clicky thoroughly, there is indeed something sticky about it. This may be due to Clicky interface. This is where Clicky flattens the ground compared to other products.

It has indeed, a concise setup and also shows many complex statistics. One more good thing is that their help section is well-defined and explains everything in detail. The only issue was absence of videos and better screenshots in tutorials.
Clicky borrows some of the data from a third-party interface, which can make it skeptic for some users. For that, Clicky just needs to create its own service.
For people who need to check the stats, they can opt-in for trial version on their site. Others can use Demo Mode. Overall, the site access and feature exploration are really tricky. You will need to learn about many web analytics terms before getting to understanding how it works.
Compared to tools like Stats Counter, Hisstats, Google Analytics, etc., they still have a long way in terms of UI. Also, readers can effortlessly learn all raw data and stats via tutorials.
Finally, for recommendation part, we request readers to try out trial version momentarily. However, we are also using Clicky for 5 years, and it is still cheaper than many products. So, if you are a stats nerd, go for it!