
Mouseflow Review
Detailed Reviews
Times have significantly changed now where even the smallest things in our life require the Internet. In this web of information, most of us are often stuck on either websites, video sites, movies, learning or anything that interests us.
Now, for each of these sites, it can be one big nuisance to manage them if we want it to grow. There needs to be a continuous effort by site makers in enhancing the UI as well as focusing on visitor’s needs. If any admins neglect such things in the modern competitive market, it can be easily overthrown by better services.
To monitor the performance of the website, visitor’s interaction, and other such website analytics stuff, we need a comprehensive setup to aid us. In the list of such products, we can utilize a few useful products in the market know as Web Analytics Tools.
These tools are the source of nectar for many websites. Without the data processed by them, it can be one big mess for the websites to learn about its traffics and its behaviour, thereby affecting site’s growth and performance.
Pros
- Hassle-free UI. The setup procedure on any website is also simple.
- Generates a full report on traffic with many stats like visitor stats, any interactions, etc.
- It can record live videos of your site.
- Uses heatmaps to show the area with varied interactions.
- Follow visitors step by step with funnel feature. Even monitor forms and conversion rates.
Cons
- The plans can be updated to return more value.
- We cannot use a single element as a step in the funnel, i.e., funnels are restricted to URL only.
- It can implement more popular integrations.
Introduction
Among the list of numerous website analytics tools, we have to analyze Mouseflow. Found in the year 2010, in one of the Nordic homes Copenhagen, Denmark, they have snowballed as one of the popular tools for website analytics. The current H.Q. are in Austin, Texas.
This product is mainly focused on website analytics and real-time stats of user interactions on your website. It is provided in SaaS form, and so it requires simple assimilation of its code into the desired site.
The service is assimilated into a website via simple java code. This code is called a Tracking Code. It will allow their service to record the data from your website like number of mouse clicks, page visits, inbound/outbound visitors, and more data related to website analytics.
After the collection of huge chunks of data, the rest of the process is entirely automatic. Admins just need to study particular data and edit a website as per visitor demands. This cycle of improvising is persistent for all the websites, and even requires an extensive set of site statistics.
In this review, our primary goal will be to inspect how Mouseflow gathers all the site data and assess how they present this data. What conclusion do they derive from the collected data? What suggestions do they give to improve specific things on our website?
Let us now begin reviewing it.
Installation of Mouseflow and its Main Dashboard
The most significant trouble new website makers face with using any analytics tool is integrating them into their site. Many of the website makers do not know the HTML codes and so installing them can be headache for them.
However, most tracking codes are merely copy-paste types. The service providers generate these codes, and we just have to copy them and then paste them into the pages we want to monitor.
The installation of Mouseflow is also very hassle-free. There is a single JavaScript code generated by them, which we have to copy and then paste on our site. There is one alternative to this, though.
They have given a direct plugin in many website makers like WordPress, Wix, Weebly, Google Blogger, and so. These plugins require you to copy-paste the code generated for a site in Mouseflow’s dashboard.
Once that is done, the rest of the process is on Mouseflow. You just have to worry about the site stats and the changes you will make for improving the traffic.

As said earlier, Installing Mouseflow seems to be very beginner-friendly and doesn’t seem to be much of a nuisance as we expected.
What to do after the code is installed? How do I start seeing the stats about my visitors? Where can I view my live traffic, as you told?
Worry not! We will come to that soon. But first, let us see what a quick glance at the main panel reveals. The main panel of Mouseflow reveals data about three main objects, i.e., visitor graph, recent recordings, and popular heatmaps.
All three represent a form of web analytics data and have to monitored accordingly. The visitor line graph gives an insight into the number of daily visitors over a range of time period. You can easily judge it based on the fluctuation when the traffic data fell and when it rose.
The current status of the site is shown on the right side — relevant analytics data like the number of live users, pageviews, friction score, and average site duration.
After that, the 2nd panel shows info of the recordings. What are these recordings? Well, there are recordings of the visitors engaging with your website. Mouseflow literally records the activity a visitor does after entering your website. Isn’t that amazing?
So, what is the use of such video recordings? The answer to that is simple, surveillance. No! It’s not a product by the FBI. The act of surveillance here is to see how different visitors interact with your website.
For example, there are some bugs or glitches on your website. Unless you see them practically, we cannot repair them. Many times, these issues are user-specific, and so it becomes more of a concern.
We will talk in detail about the recording function later on. For now, it is the most utilized feature of Mouseflow, giving lots of info about user behaviour.

Last but not least, a central panel even reveals info about the recorded heatmaps. The functions and assessment of these heatmaps will be done later in the article. For now, just know that similar to the recordings feature, it collects data about the number of clicks made by visitors and which area of the website is most used.
There are UI features that are all part of QOL updates. Of that, there are several drop-down menus. Out of these, one of them allows picking the site for monitoring. Other ones include options to filter the results on the graph with many unique criteria, and then sort them based on visitor type.
We can even pick an HTML code and adjust site settings from the options besides these graphs. All in all, you get a short and sweet overview of your site’s performance.
For more details, you need to dig into individual setups. So, without roaming around, let us march to these topics.
Live Website Recording in Mouseflow
Isn’t it refreshing to know the role of live cameras in maintaining so much order in modern cities? Police can react to many incidences quickly without having to ask who started the brawl, or picking on master criminals as soon as they land out of their ratholes.
There are many benefits of such live-recording or even delayed recordings. The entire picture of the incident becomes clear. So, how are these recordings relevant to websites? How can they help a site owner like me in improving my services?
Honestly, these queries can be only cleared once you have a hand on these features. It cannot be explained in a single review. Regardless, we will keep it brief and focus more on the topic if the recoding feature is working or not in Mouseflow.
In Mouseflow, head to the Recordings Tab from the left side navigation bar. From there, the entire history of every recorded page is shown. On this page, we are given filters to sort out the desired footage we want to monitor.

There are options to view the live stream of current visitors. The information shown in visitor recordings is detailed. We can switch through any of them and even filter out selected IP or a user.
Once you have picked a recording to review, click the play button. A new window will open, which will show full records. In this recording, we can identify customer behaviour, which will eventually help us in getting more details of visitor needs.
Specific functions can enable us to control the player settings. They all are assigned some shortcuts to ease the control of the player. The top menu bar allows us to switch between any desired recording directly.
Admins can even add comments, tags, identifiers, download, or even delete the recordings from this menu. We are sure you’ll love to use this feature once you get a hand on it. There isn’t anything else to configure here besides watching the videos.
The main power here lies in the observation skills of the admins. Out of tons of recordings, figuring out the bugs, UI issues, etc., is onto the admins. Arbitrating the recordings is on the site owners.
And so, we finish viewing the recordings section. As seen above, the information handed out is in-depth, and the UI itself is very helpful. You can even follow specific visitors who experience unique issues on your site. With time, you will be able to discern useful recordings from the unwanted ones.
Checking Visitors’ Click History with HeatMaps
Have you ever gone through a heatmap? If you haven’t, you must check it out first. For starters, a heatmap is a graphical representation used to show the intensity of an activity.
This can be anything like a weather heatmap, population heatmap, and for websites, click analytics heatmap.
This click-based heatmap is used to see the activity of a visitor on your site. It allows admins to know which area, which links, and the most used section on your website. There is much more info that admins can gather from these heatmaps.
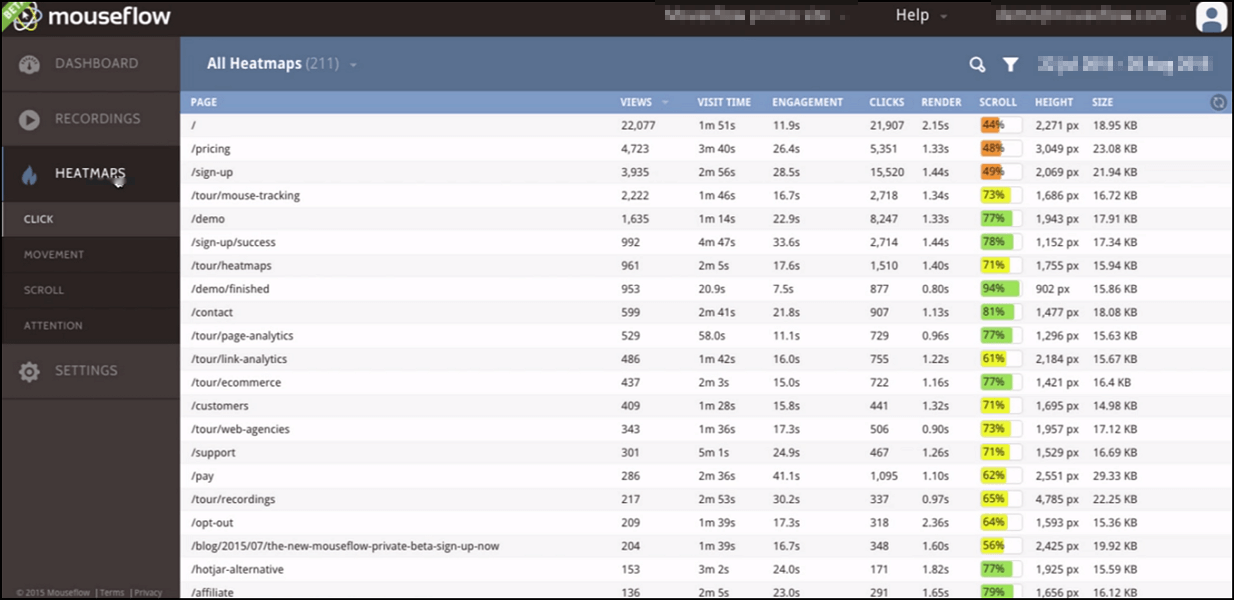
In Mouseflow, heatmaps are used for the same. We can access them via the HEATMAPS Tab on the left navigation menu. The heatmap in Mouseflow is divided into sections based on visitors’ interactions like clicks, movements, scrolls, etc. Let’s see what these heatmaps show?
The first candidate for these heatmaps is Clicks. One of the most notable things to monitor, clicks decide the fate of a website. To precisely track these clicks, we use click-heatmap.
Out of many snapshots, pick one from the list of click-map. Now, if you carefully observe, there are several filters given by Mouseflow.
It has views, scrolls, render, size, and such things to discern the heatmaps and filter out the needful one. Once the heatmap page opens, we won’t see any colourful division of our site, like a weather map.

The top menu of the interface manages the opacity and intensity of the colours. You can switch between clicks, hovers, movements, scrolls, and attention from a drop-down menu above.
Each link, script, form, or any interactive elements of your site will display a click counter. Move the cursor onto one of these, and you’ll see better details on average clicks, multiple rage clicks, mouse hovering, etc.
As you can see over the screen, most of the data here are self-explanatory. You need not be some pro to understand them. The two exciting options are the movement and attention heatmaps.
The movement's heatmap gives full information about the mouse movements done over the screen. Use the colour scale below to distinguish what each shade of colours represent.

Overall, you will enjoy learning this entire setup. The Scroll & Attention heatmaps show a fully coloured map. The red colour shows max engagement, whereas dark blue depicts the lowest engagement. And so, you’d want the important content to be in the red zone.
Mouseflow will reveal more information about the above two functions if you hover the mouse on a particular colour of the heatmap. There is also a Geography Tab that can let you see the above details on the world map. Truly amazing!
All in all, it was really remarkable from Mouseflow to offer such unique features along with detailed info about each interaction. The UI was too sleek, and genuinely, there is no need to have more than basic knowledge about these terms to understand the heatmaps.
Funnels, an Interactive Way to Monitor Visitor Actions
On most websites, converting routine visitors into customers is very systematic. For example, for an E-commerce site, there are preset steps the customer needs to do before purchase.
Many times, the visitors cancel their transaction midway. To know the real deal behind these non-conversions, the concept of funnel monitoring is used by websites.

Just like a real funnel guides fluid through a narrow passage, this funnel too helps us in narrowing the causes hindering successful conversions.
Here, the funnels are like steps, which visitors must climb to become successful customers. We can set up such events that new visitors must pass to become real customers.
Failing on any of these steps will let admins understand the real cause of lesser conversion rates. Also, we can improve the site’s content based on traffic cut-offs at a specific action.
To create a new funnel, head on the Funnel Tab from the left menu bar. In this section, funnels are made by adding a site URL. This is very obstructive compared to top products.
There is no option to pick and input an action into the funnels. These actions are shown in the above heatmap section, like clicks, hover, scroll, or any other user interaction.
Taking the example of simple survey sites, we can create very basic funnels. To add an event into it, we need to put the URL, which will be visited by users to get converted.
The first step will be to visit the homepage. After that, click on the registration link, register a visitor, and then display the success page. Next, redirect them to the survey page. The submit button on the final survey page is a full conversion.

All of these need to be added to the funnels. Once done, save this funnel. It will now monitor these pages and return live information about it. Now a 100% conversion rate would mean the visitor has successfully submitted the survey and got their discount coupon.
Alas! Visitors leaving at any step before getting the coupon page will be considered not converted. All you need to do is insert the sequence of these events, and Mouseflow Funnel will oversee the rest for you.
The funnel screen will show live results of each conversion. Let us say there is some bug on the registration page, where it won't redirect to the survey. Now, you will notice this in the funnel that most visitors are dropping after the registration completion page.
We can see preciously the point where a customer left us. This becomes more relevant and easier to setup in case of an E-commerce website. The funnel data is also downloadable in CSV format.
You can use it in a variety of ways to leach information about visitors, their habits, bugged pages, etc. The setup is on par with other top products like Heap Inc., Click tale, and Smartlook. The only con here is that there is no option to add individual interactions rather than a full URL.
Many tools like above allow us to add individual scripts into the funnels like clicking buttons, play button, or any interaction with a unique site element. This sounds way too detailed, but we feel that it is crucial and can be integrated easily.
Monitoring Forms and Feedbacks with Mouseflow
Forms are among the most monitored element of a website. This is because they are a useful tool to gather information about the visitors, their opinions, surveys, etc.
The more the participation rate of these forms, the better reviews and feedbacks we get about a site. Forms range from various types like a simple registration form, feedback form, contact form, support form, etc.

With Mouseflow, we can monitor all conventional forms. The only issue is that they have to be set by the admins. Mouseflow will only detect and add a form present in the list of monitoring.
Inserting them is quite simple. Just head on to the respective section, click Add New. After that, input the URL of the form to be monitored. Thereon, Mouseflow will follow each interaction with these forms and give you precise feedback on their usage.
On the main panel of forms in Mouseflow, we can see comparative graphs to quickly discern which one is progressing and which one is getting behind. This is somewhat akin to funnels, where we can monitor the interactions with these forms.
The monitoring even monitors the field which is interacted but not filled. This shows hesitation of the visitors. Especially something like email ID is not inputted quickly unless the visitor is a complete noob. This is due to privacy issues.

Such things hint us how to ease feedback along with protecting the identity of a customer. We need to be smart in interpreting the data shown for typical forms and feedbacks. We believe that with time, you can get plenty of experience in understanding how this setup works. The good part is that it isn’t complicated like you think of it.
Final Conclusion
Digging through every corner of Mouseflow, we can say they indeed impressed us. Initially, we were a bit skeptic, but that quickly turned around once we started expending their services.
The details, as well as ease of access, is what makes them very unique. They advertise what they can accomplish, which is very honest. Although some of the advanced monitoring tools are missing, we still get very relevant and complete information about visitor engagement on our website.
There is nothing new to be suggested in it for now. The cost of their service is very inexpensive. Overall, Mouseflow is worth a try. If you still need to test its features, feel free to utilize its cost-free trial.